
OpenTelemetry 基準測試:AI 能追蹤你的登入失敗嗎?
一項基準測試評估了 14 個 AI 模型為程式碼庫添加 OpenTelemetry 儀器化以進行分散式追蹤的能力,結果顯示所有模型都面臨嚴峻挑戰,即使是 Claude 4.5 Opus 和 GPT 5.2 等進階模型,成功率也很低。
![]()
Benchmarking OpenTelemetry: Can AI trace your failed login?
Frontier AI models have become excellent at writing functions, but can they actually debug production systems?
To fix outages, you first need to see what’s happening. In a microservices world, this means producing structured events that track a single request as it hops from service to service.
We asked 14 models to add distributed traces to existing codebases, using the standard method: OpenTelemetry instrumentation. We picked tasks that would be easy for a Site Reliability Engineer (SRE).
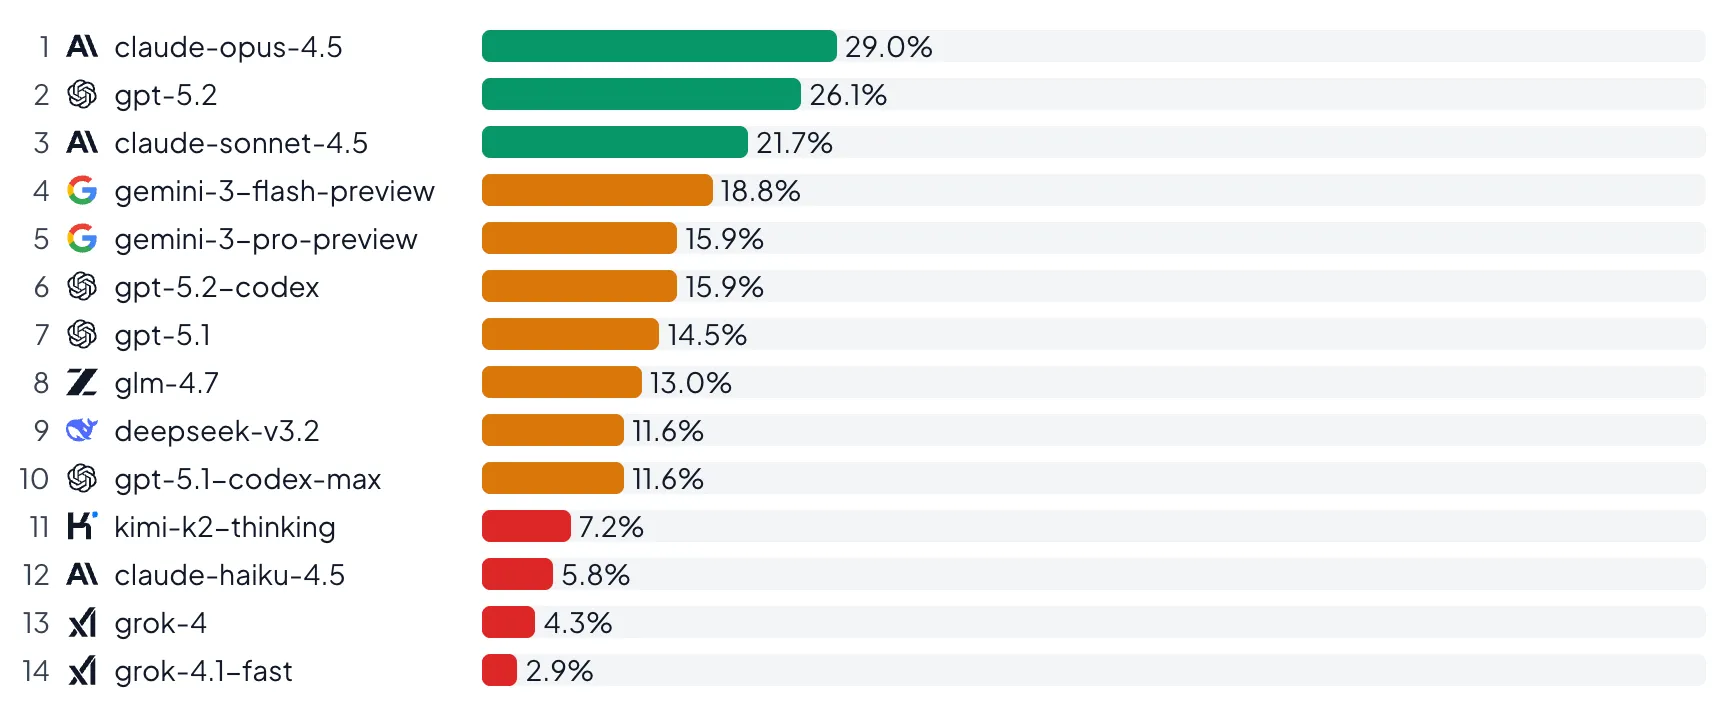
Go to OTelBench website for complete charts. All models struggle with OpenTelemetry. Even the best model, Claude 4.5 Opus, succeeded only 29% of the time, and GPT 5.2 was similar at 26%. Surprisingly, Gemini 3 Pro has no edge over Gemini 3 Flash, which scored 19%.
We are releasing OTelBench as an open-source benchmark, with all tasks in QuesmaOrg/otel-bench. We use the Harbor framework (by the creators of TerminalBench), so you can easily run it yourself to reproduce results, test new models, or create benchmarks for your own use cases (we welcome contributions!).
Background: What is distributed tracing?
When an app runs on a single machine, you can often trace an error by scrolling through a log file. But when it runs across 50 microservices, that single request gets scattered into a chaotic firehose of disconnected events. Distributed tracing solves this by linking them back together, allowing you to follow a user action, like clicking Login, as it jumps from the API Gateway, to the Auth Service, to the Database, and back.
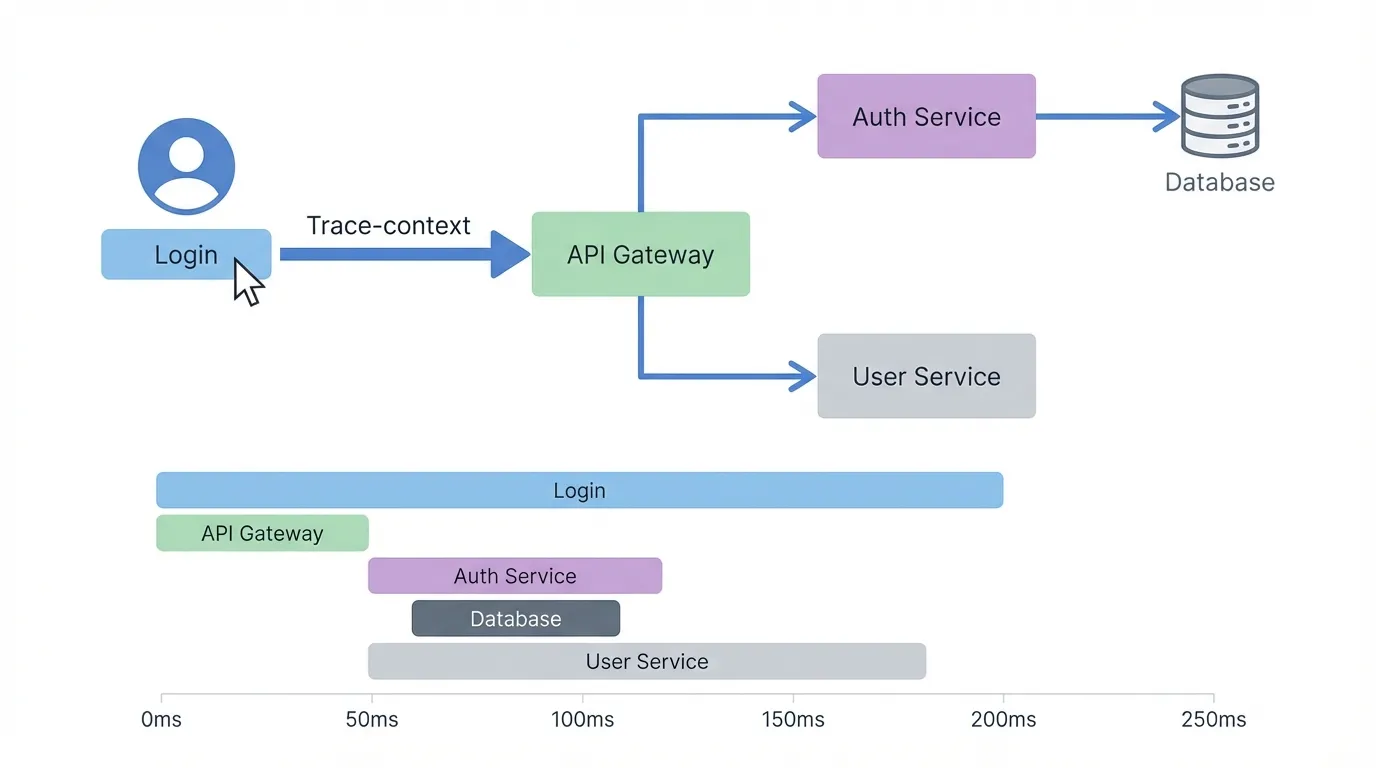
Distributed tracing links a user action, like a Login button click, to every underlying microservice call.
To make this work, you need instrumentation. This is code that you add to your app to:
OpenTelemetry (OTel) is the industry standard for telemetry data. Its ecosystem includes:
However, standard doesn’t mean easy. We know this firsthand from our contributions to the ecosystem, such as Go compile-time instrumentation. The process may be difficult, especially due to complexity, as 39% of respondents complained in the 2025 Observability Survey.
Benchmarking OpenTelemetry instrumentation
We tested 14 frontier LLMs on 23 realistic OpenTelemetry instrumentation tasks across 11 programming languages: Go, Java, C++, Python, JavaScript, PHP, Ruby, Rust, Erlang, .NET, and Swift.
It is essential to benchmark various technologies since realistic distributed systems are polyglot.
To make OpenTelemetry work, the system needs to work for all of these services - if we lose track at only one service, the chain of logs gets broken.
The final benchmark run cost $522 in LLM tokens across 966 runs (23 tasks × 3 attempts × 14 models).
Task
We start with basic tasks such as adding instrumentation to a single microservice, in a single language.
The AI agents get a small microservice with around 300 lines of code from a realistic application, and work in a Linux terminal, editing it, and running any commands if needed.
For example, here is the prompt for go-microservices-traces:
Your task is: Add OTEL tracing to all microservices.
Requirements:
We tested if it satisfies the basic criteria of OpenTelemetry instrumentation.
See full task breakdown. All tasks were simple for humans and involved short services of around 300 lines of code. Yet, many of them were hard or unsolvable by all AI models.
Example
How do LLMs fail? Let’s analyze a common failure mode.
Consider a web service from our benchmark where a user searches and retrieves results. The test simulates two distinct user actions:
A human engineer would immediately distinguish these as two independent events, resulting in two separate traces: one for the successful search and one for the failed request.
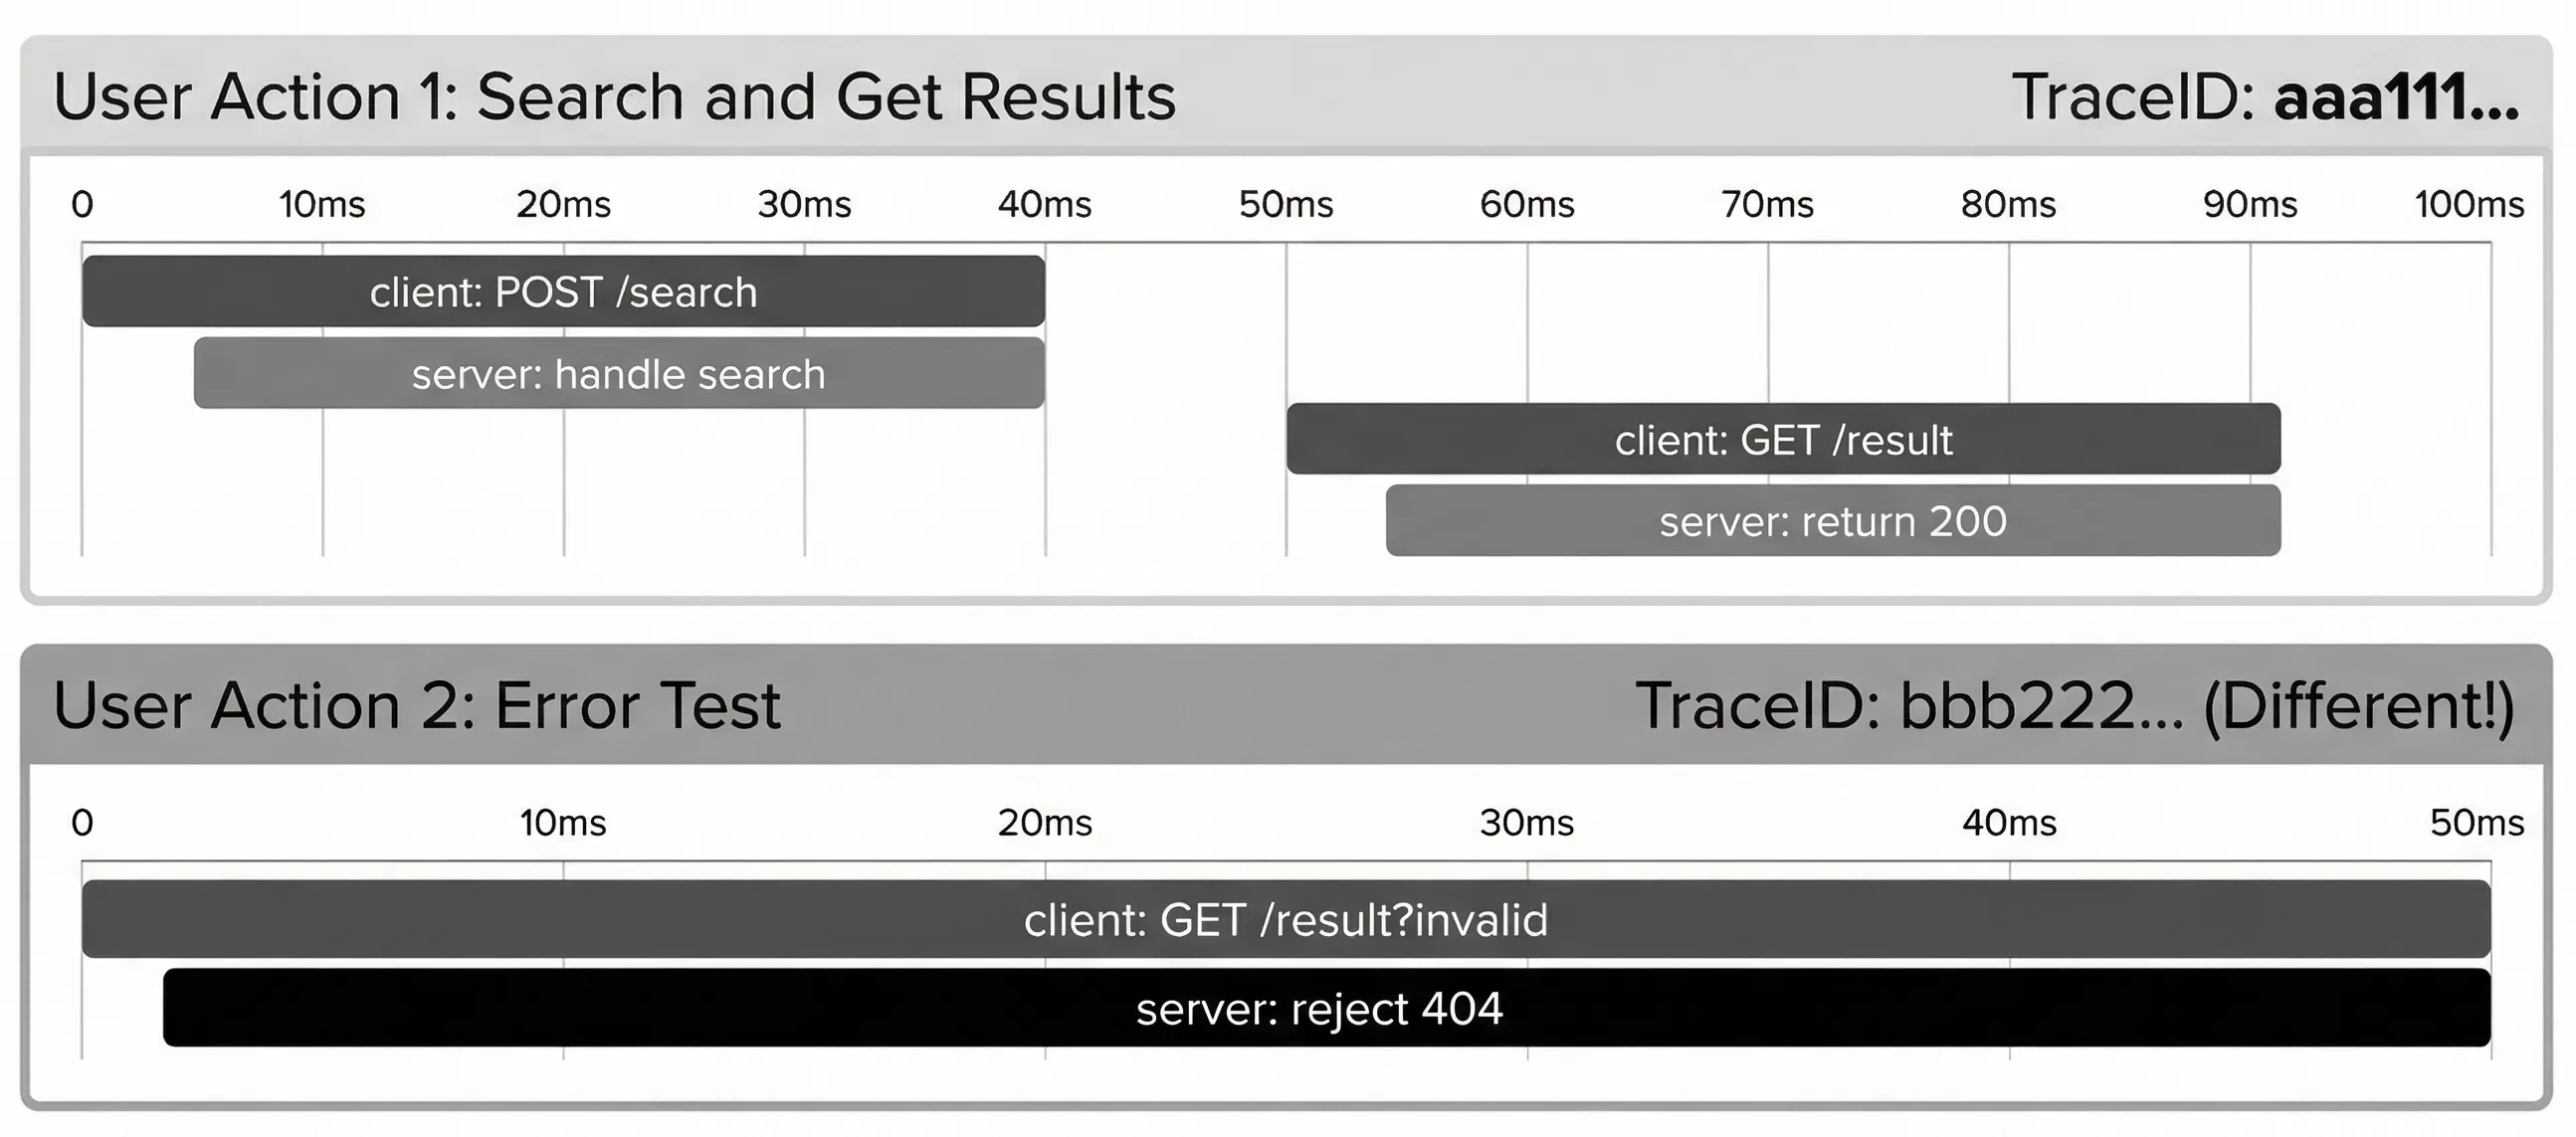
Expected behavior: Two distinct user actions should produce two separate traces with unique TraceIDs.
The code structure makes this clear – two separate blocks, each representing a user action:
Models failed to recognize these as separate user actions. Instead of two traces, they produced:
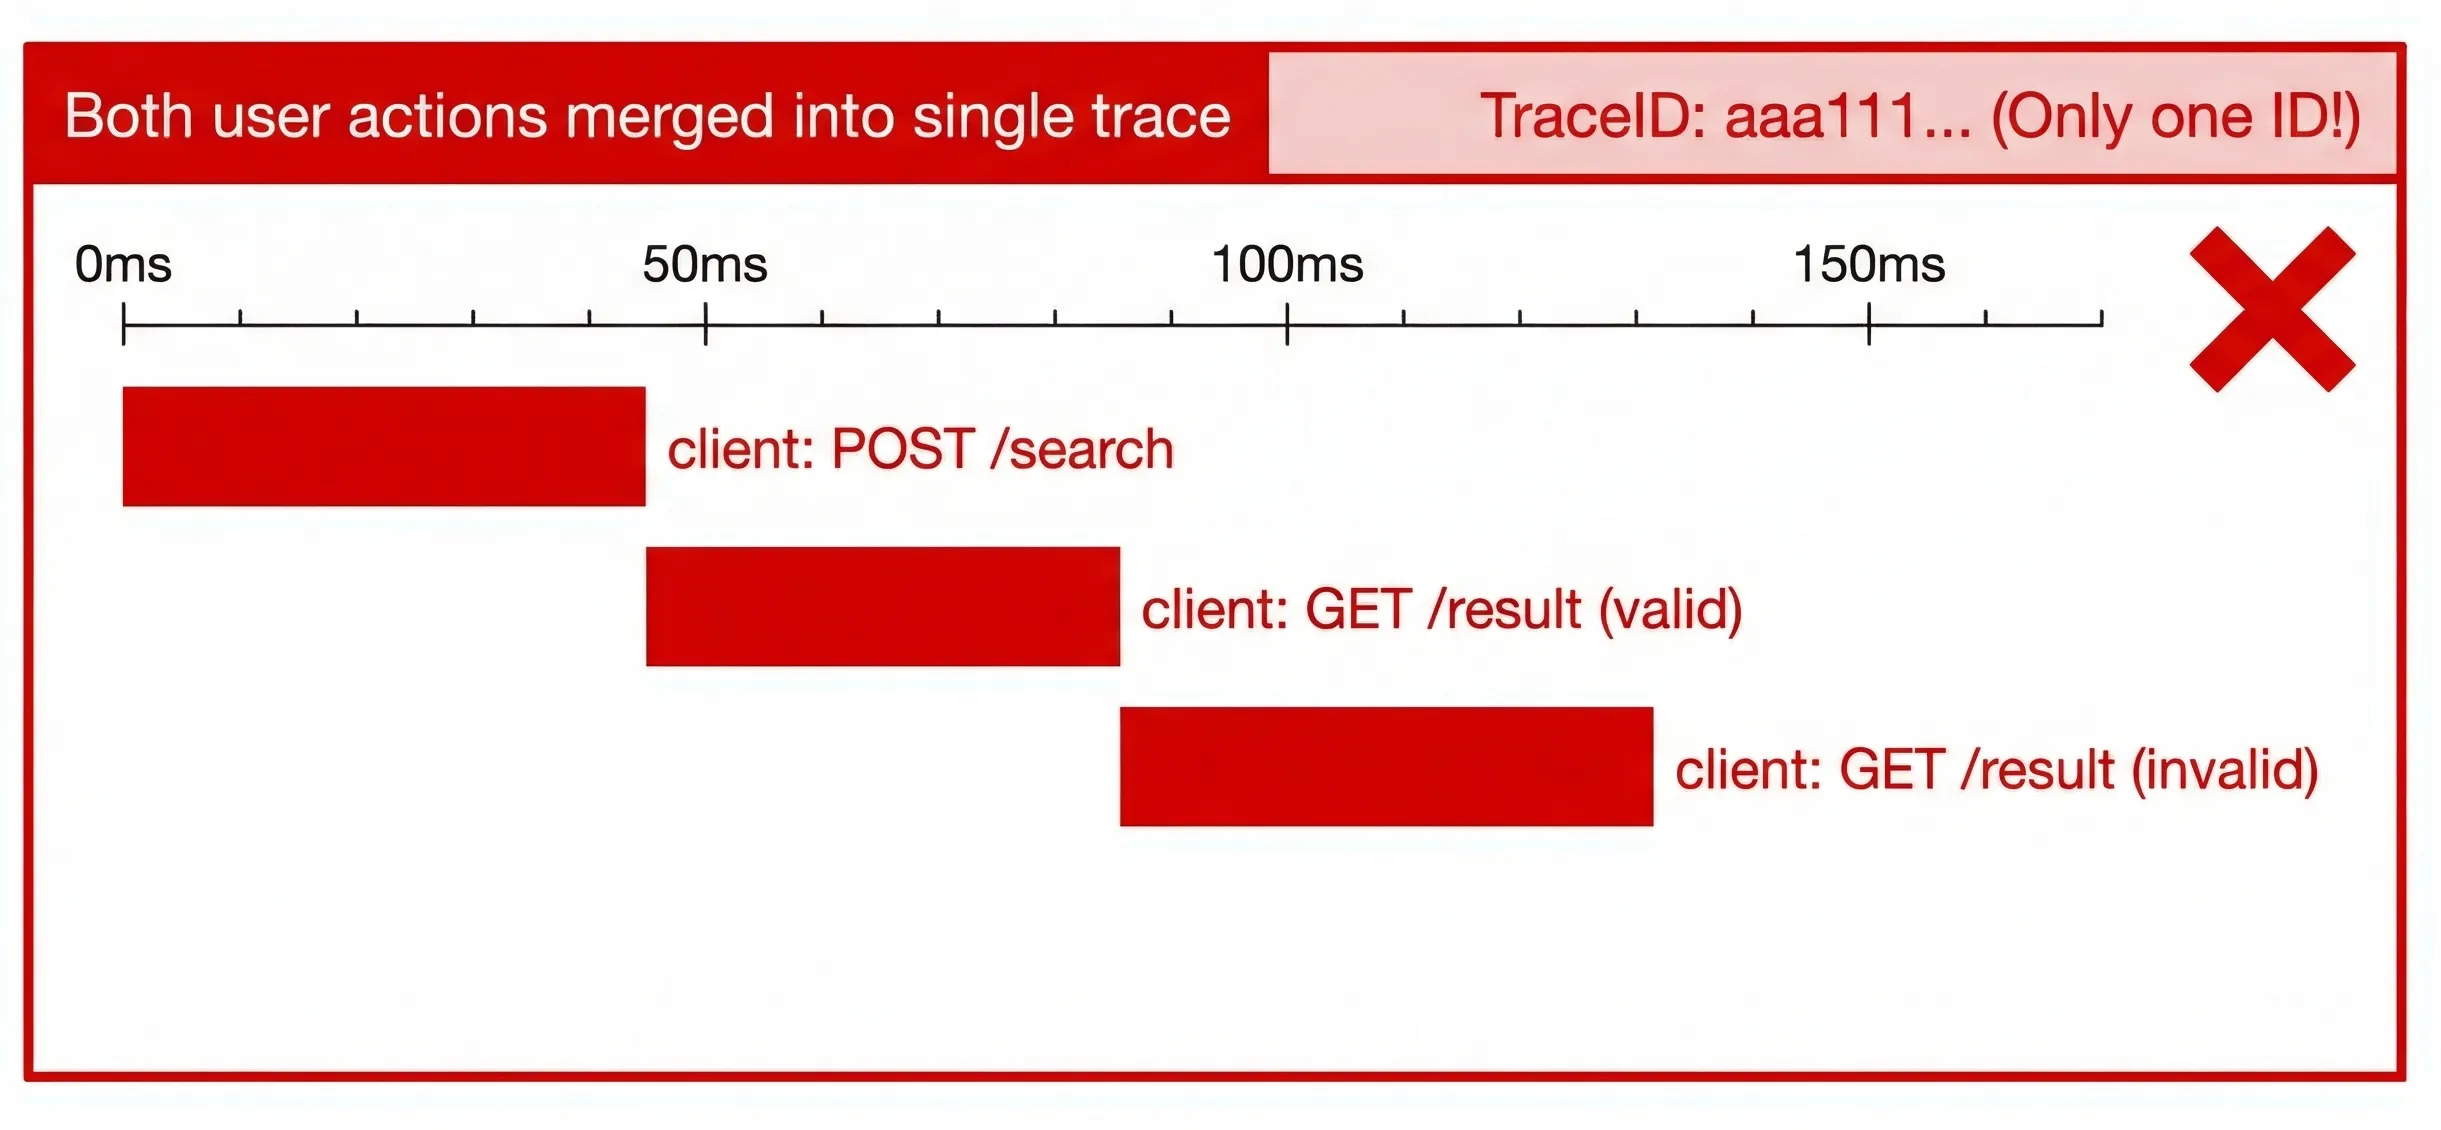
Actual result: Models conflated separate actions into a single trace.
The core issue: Models apply instrumentation mechanically to every HTTP call without understanding the business context. They see “HTTP requests” and link them all together, rather than recognizing “these are two separate user journeys.”
The models successfully instrumented the HTTP calls, but failed to propagate the Context correctly. They treated the timeline as a single flat list of events rather than two distinct hierarchical trees.
Our tests don’t just check compilation. We verify correct span names, parent-child relationships, valid trace IDs, and context propagation. Many models produced compiling code that generated malformed traces – proving that “it builds” is not enough for SRE work.
Observations
Models
We were surprised that even the top models (as of Jan 2026) struggle.
The tasks we proposed were trivial compared to real-world scenarios. In a typical SRE job, services are massive, legacy-ridden, and poorly documented. If models fail on 300 lines of clean Go code, they cannot handle production.
We were surprised that:
Languages
Each language has a different toolset, so it is not an apples-to-apples comparison. Our benchmark is too small to perform a comprehensive per-language comparison, yet even preliminary trends are striking.

Models had some moderate success with Go (a go-to language for distributed systems) and, quite surprisingly, C++. A few tasks were completed for JavaScript, PHP, .NET, and Python. Just a single model solved a single task in Rust. None of the models solved a single task in Swift, Ruby, or (to our biggest surprise, due to build issues) — Java.
Cost and time efficiency
In every practical application, cost and speed matter.
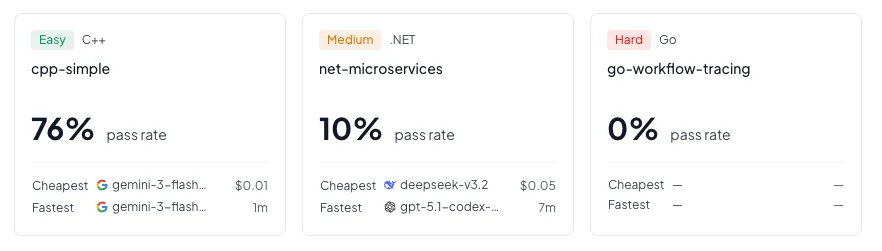
As of Jan 2026, the Pareto frontier consists of only four models, given model performance:
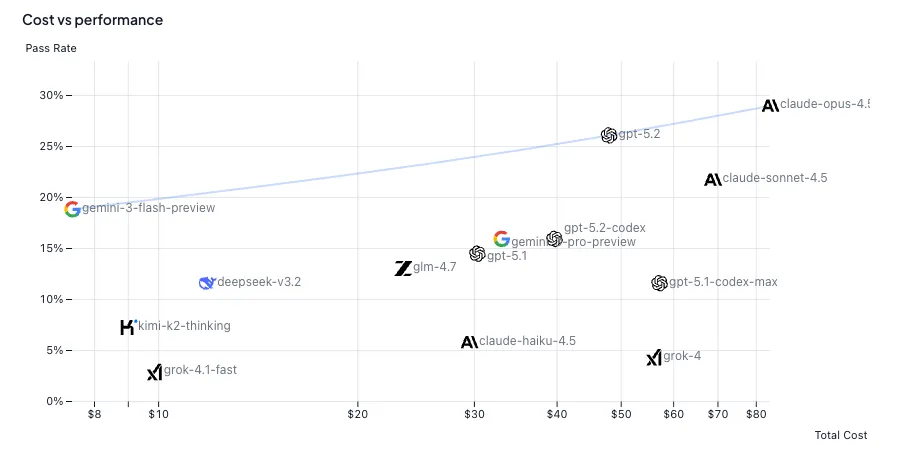
See cost vs performance chart.
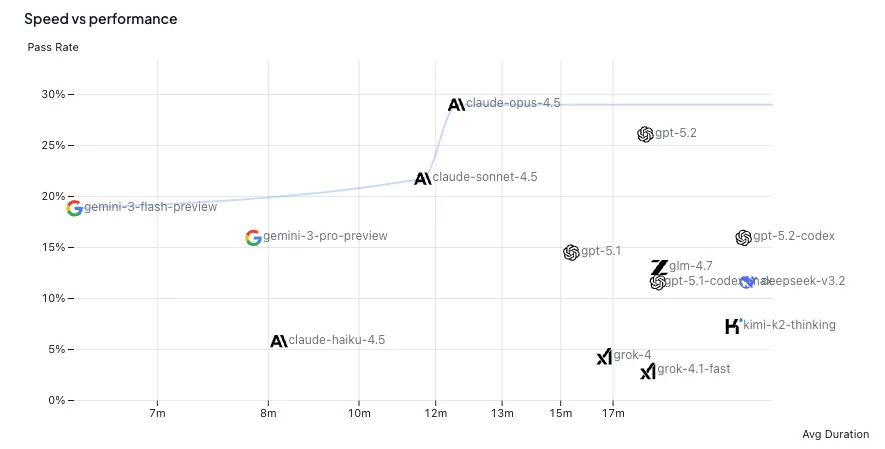
See speed vs performance chart.
Why OpenTelemetry instrumentation is hard for AI
OpenTelemetry has all the potential to be a perfect task for AI agents — it is long and tedious work, requiring a lot of scrutiny, but ultimately one that has clear specifications and can be easily tested.
Yet, even the frontier models fail miserably.
It is a job, not a puzzle
Instrumentation of even a small service involves long-horizon tasks, which remain at the frontier of the current AI model progress.
It requires diligently connecting all pieces of code and testing them correctly.
Requires polyglot backend development skills
Realistic services use multiple languages and technologies.
It is not enough to know the concept of distributed tracing, the OpenTelemetry standard, or even the APIs of SDKs. The agent must know CMake for C++, module systems for Go, or dependency management for Java - things we tested in our previous benchmark, CompileBench.
Usually, cloud environments are mixtures of the newest versions of technologies (sometimes past the training cut-off dates of AI models) and legacy systems. We cannot cherry-pick or rewrite everything, since a possible outage would be too costly. We need to support all languages and frameworks used in the cloud.
A lot of current AI progress focuses on the most popular languages (Python and TypeScript) and reasonably modern frameworks and build systems.
Less training data
Although adding instrumentation is a standard engineering task, it is not common practice in open-source. The most popular applications, where reliability matters the most, are in private repositories of big tech companies such as Apple, Airbnb, or Netflix.
Conclusion
Key takeaways
AI SRE is still mostly hype, but there is hope
AI SRE in 2026 is what DevOps Anomaly Detection was in 2015 — bold claims backed by huge marketing budgets, but lacking independent verification. There are stories of SaaS vendors abruptly killing the observability stack. Our results mirror ClickHouse’s findings: while LLMs can assist, they lack the capabilities of a skilled SRE.
Claude Opus 4.5, GPT-5.2, and Gemini 3 models show promising signals. Some hard tasks like go-microservices-traces reached 55% pass rate. With more environments for Reinforcement Learning with Verified Rewards, this looks like a solvable problem.
Looking forward
Reliable software is incredibly economically valuable, but today it requires too much toil. No one wants to be woken up at 2 AM to troubleshoot.
We need a North Star to navigate the current AI boom. Just as SWE-Bench and TerminalBench2.0 became standards for software engineering, we need an SRE-style benchmark for distributed systems. Does the industry need newer models, or perhaps multi-agent systems? A good benchmark will tell us.
We invite you to explore the full results on OTelBench and help us expand the test suite on QuesmaOrg/otel-bench. Have you tried using LLMs for observability? We are curious to hear if your experience matches our findings—or if you’ve found a workflow that actually works.
But for now, the verdict is clear: if you need distributed tracing across services, expect to write that code yourself.
Stay tuned for future posts and releases
Related Articles
Continue exploring similar topics
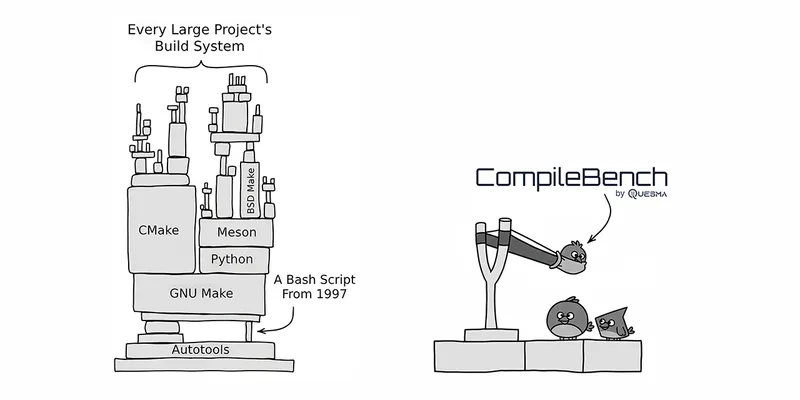
CompileBench: Can AI Compile 22-year-old Code?
We tested 19 LLMs on their ability to handle real-world software engineering tasks like compiling old code and cross-compiling. See how Anthropic, OpenAI, and Google models stack up in our new benchmark – CompileBench.
Tau²: From LLM Benchmark to Blueprint for Testing AI Agents
Deep dive into the Tau² benchmark that goes beyond LLM evaluation to reveal innovative methodologies for testing AI agentic systems in realistic scenarios. Learn how this framework can transform how we test AI-powered software.
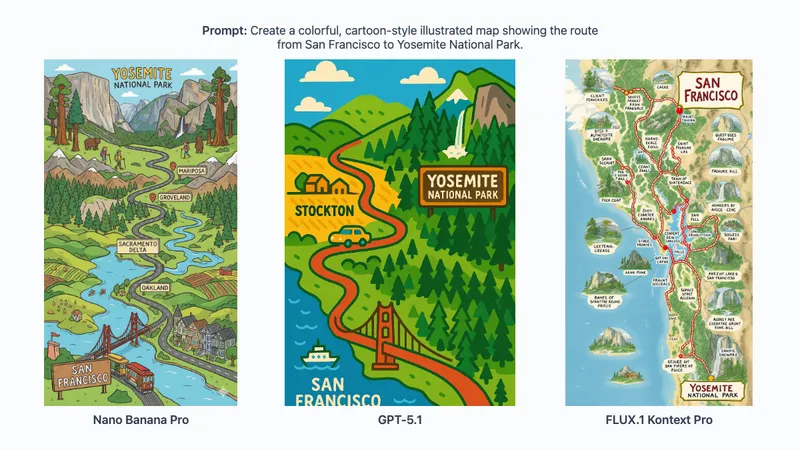
Nano Banana Pro: raw intelligence with tool use
Finally, an AI that can draw a map or create an infographic. The capability of leveraging tools pushed the frontier of image generation.
CompileBench: Can AI Compile 22-year-old Code?
We tested 19 LLMs on their ability to handle real-world software engineering tasks like compiling old code and cross-compiling. See how Anthropic, OpenAI, and Google models stack up in our new benchmark – CompileBench.
Tau²: From LLM Benchmark to Blueprint for Testing AI Agents
Deep dive into the Tau² benchmark that goes beyond LLM evaluation to reveal innovative methodologies for testing AI agentic systems in realistic scenarios. Learn how this framework can transform how we test AI-powered software.
Nano Banana Pro: raw intelligence with tool use
Finally, an AI that can draw a map or create an infographic. The capability of leveraging tools pushed the frontier of image generation.
![]()
相關文章
其他收藏 · 0