Show HN:QTap DevTools – Linux 適用的 Chrome 風格加密流量檢查器
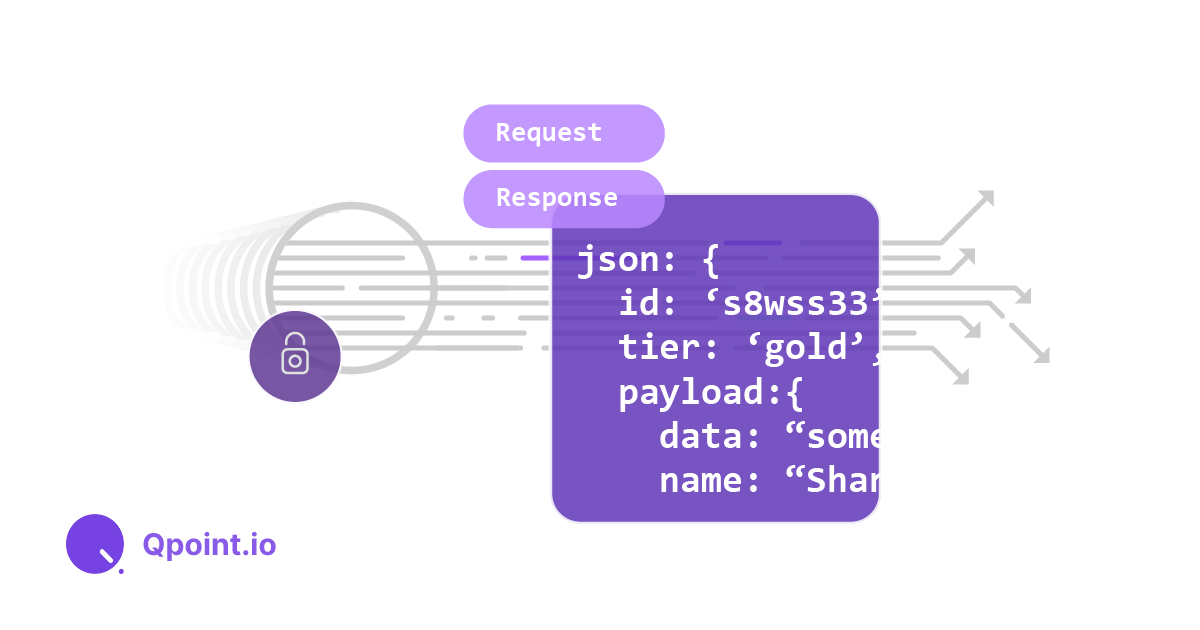
QTap DevTools 是一款新的 Linux 原生工具,提供類似 Chrome 開發者工具的網路分頁功能,可直接在瀏覽器中檢查即時的 HTTP/S 流量,無需代理或程式碼變更。它利用 eBPF 在加密前後擷取流量,提供詳細的請求/回應分析,用於除錯。
Qpoint DevTools
Chrome-Style Network TabFor Your Linux Server
See live traffic without proxies, certificates, or code changes
View on Github
See a Demo

Debugging Live Traffic is Painful
Traditional debugging tools stop working the moment HTTPS encryption enters the picture, leaving you guessing what went wrong when APIs fail in production.

Inspect Live Traffic in your Browser
QTap DevTools gives you a local browser-based view of all HTTP/S traffic on a single host. Perfect for emergency troubleshooting when you need to debug a specific server right now.
How It Works
A lightweight, Linux-native sensor running in a guaranteed safe eBPF sandbox, taps into network traffic before and after encryption occurs. The raw data is then re-assembled into protocol-level events and forwarded to a browser-based interface.
View Installation Instructions

Key Capabilities
eBPF hooks into TLS libraries before encryption happens
Know exactly which container made each request
Full request/response with headers, body, and timing
New requests appear instantly via Server-Sent Events
What's in the Box?
Requests
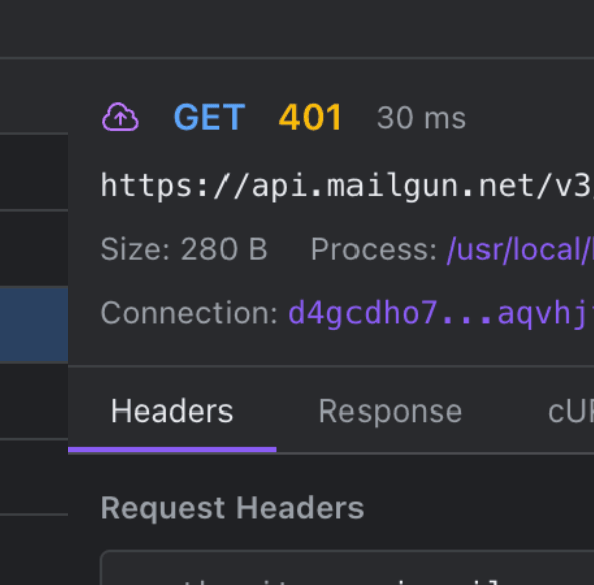
The closest equivalent to Chrome DevTools' Network tab. Click any request to inspect the complete transaction, copy as cURL, and debug authentication failures by seeing exactly what was sent.
Connections
Every network connection with process attribution. See which external services your application connects to and identify unexpected outbound connections.
Processes
A real-time inventory of every process on the host. See what's actually running and correlate processes with network activity.
What Makes DevTools Different
Shows plaintext HTTP/S automatically, no TLS keys needed
No certificate installation, no proxy configuration, no restarts
Captures complete HTTP/S traffic automatically, no code changes
Single-host emergency troubleshooting vs. fleet-wide monitoring
QTap DevTools brings the familiar Chrome DevTools experience to server-side debugging. Perfect for emergency troubleshooting and production incident response.
FAQ
No, QTap DevTools is out-of-band and read-only, ensuring zero impact on latency or application performance. It captures traffic passively without interfering with your applications.
No, QTap DevTools is safe and secure. The sensor runs in a guaranteed safe eBPF sandbox, which cannot crash your kernel.
A lot of time and effort is spent to ensure QTap is lightweight and uses minimal resources. For most workloads, you can expect to see less than 1% of CPU and less than 200MB of memory.
No, root access is required to run QTap, and if running in a production environment, we recommend binding to 127.0.0.1 and using SSH port forwarding to access the interface. There is no more risk than using any other traffic inspection tool.
DevTools currently shows the process and connection metadata and all HTTP/S requests and responses. Additional protocols will be available very soon (PostgreSQL, MySQL, Redis, Kafka, DNS, etc.)
Qtap works with all major apps and languages, including Node.js, Python, Java, Go, Ruby, PHP, and more. If you don't see http traffic from your app, let us know!
Yes, QTap is free and open source. It is available on GitHub under the AGPL-3.0 license.
Yes, QTap Pro is available under a commercial license. Please contact us for more information.
No, QTap DevTools is currently only supported on Linux. In the future, we will release QProxy to support non-Linux platforms.

相關文章